The 300 Bytes That Saved Millions: Optimising Logging at Scale
Sometimes, tiny changes can have a massive impact. One of my favourite examples of this effect can be found in the Battle of Thermopylae where the Persian Empire fought an alliance of Greek city-states led by Sparta. The Greek force of approximately 7,000 men led by Leonidas marched to block the pass of Thermopylae. The Persian army, estimated to be between 120,000 and 300,000 soldiers, arrived at Thermopylae, but the Greeks blocked the only road where they could pass. The battle lasted two full days and the much smaller Greek army won. It’s a great story about how a small hero fights a big supervillain, revealing the hero’s power. This is exactly what happened in our logging cost reduction initiative where small changes had a big impact.
YAMS (Your Adevinta Media Service) is a media content delivery service provided by Adevinta’s Data & Analytics Tribe. All of the marketplaces in Adevinta rely on it to deliver more than 800 million images, documents and videos daily.
 By A.Davey - This file has been extracted from another file, CC BY 2.0
Our logging platform
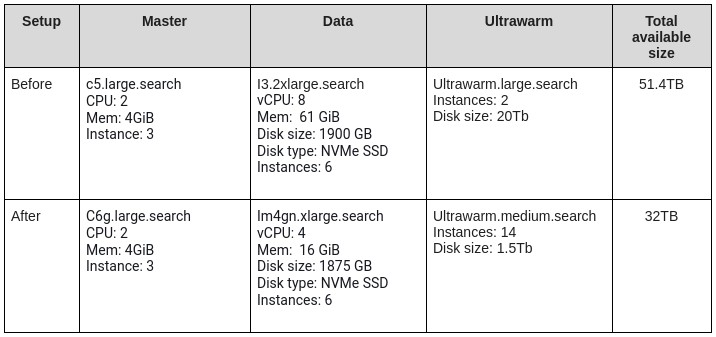
We use a logging platform based on AWS OpenSearch, consisting of a managed cluster with three master nodes, six data nodes and two ultrawarm nodes. This setup could store around 54 TB of logs, but came with a hefty monthly cost of over €7,500.
While this platform served us well, we were always looking for more efficient and cost-effective solutions. That’s when we found vector.dev or Vector, a high-performance observability data pipeline that would streamline our logging process. And so we replaced the filebeat collector with Vector.
One of the standout features of Vector is its ability to add programmable transformations. This powerful capability allows us to shape and manipulate log data as it moves through the platform. it enables us to deduplicate, modify, replace or remove log lines as soon as they reach the Vector agent.
In this post, we’ll dive into how we used Vector’s programmable transforms to implement several improvements in our logging pipeline, ultimately leading to a more efficient and cost-effective solution.
Improvements
We were able to implement several key improvements to our logging pipeline. These enhancements streamlined our logging process, optimised our storage and improved the overall quality of our log data.
Remove redundant white spaces
One of the first improvements we tackled was removing redundant white spaces from our log lines. This simple step helped reduce the storage footprint of our logs, making our logging infrastructure more efficient.
Take a look to this log line:

Can you see the issue? There is extra white space before and after quotes. These unnecessary white spaces consume 5 bytes of storage. Removing them is a tiny improvement, right?
While it may seem insignificant at first glance, given the huge volume of logs our service generates, this small optimisation had a substantial impact. By eliminating unnecessary white spaces, we achieved an impressive reduction of 3.36 GB in our daily log storage requirements. Not bad!
Change requestId format
Next, we focused on optimising the format of the requestId field in our logs. Previously, we were using the UUIDv4 format, which, while providing a large set of non-colliding identifiers, was quite lengthy at 36 bytes. For example, a typical UUID looks like this: 1bd2e63c-a139-4019-985e-0b9c0e1c58de.
However, we realised this format was unnecessarily verbose for our use case, leading to wasted storage space. After careful consideration, we decided to replace the UUID format with a more compact alternative called nanoids.
Nanoids are shorter, yet still capable of generating a vast number of collision-free identifiers. They achieve this by generating a random UUIDv4 and then translating it using a different alphabet and base. By switching to a 21-character nanoid format for our requestId field, we reduced the storage footprint significantly.
Given the scale of logs our service generates, this change resulted in a remarkable daily storage saving of 28GB.
Change log_file attribute by app attribute
The third optimisation we implemented was related to an attribute called log_file. Previously, we were sending this attribute as a string specifying the full path of the log file used. However, we noticed that this path followed a standard format across all our services: /opt/${app}/logs.
Sending the entire path for every log entry was redundant and led to unnecessary storage consumption. After analysing our logging patterns, we realised we could simply log the app name instead of the complete path, as the rest of the path structure was consistent.
Using Vector’s transforms, we replaced the log_file attribute with a more concise app attribute, containing only the application name. This simple change had a profound impact on our storage requirements, resulting in daily savings of approximately 71GB.
Change instance identifier to IP address
Our logs identified instances using the hostname attribute, which was 43 bytes long. However, in practice, we typically identified instances by their IP addresses, rendering the hostname attribute less useful for our purposes.
To optimise this aspect of our logging, we replaced the hostname attribute with the instance’s IP address. This change involved modifying the log line to include an “ip” attribute containing the IP address, for example: {“ip”: “10.113.50.139”}.
This simple substitution significantly reduced the storage footprint of our logs. This improvement allows us to save approximately 61GB every day.
This optimisation contributes to storage efficiency and aligns our logging practices with our operational workflows. Since we primarily identify instances by their IP addresses, having this information readily available in the logs streamlined our troubleshooting and analysis processes.
Do you want more?
Remove duplicates
Our investigations found that we were logging timestamps twice – one added by the logger, and another by our application. Both timestamps were identical, presenting an opportunity for consolidation. Removing one of the redundant timestamps saves more than 40GB daily.
Another area of improvement involved the logging of JWT tokens used for authentication. We noticed that two of our services, the API Gateway and SIAM (the internal service responsible for authentication), were logging the same JWT token information, see an example below. These JWT tokens could be quite lengthy, reaching up to 800 bytes. By eliminating redundant logging, we achieved significant storage savings.

We also identified a duplication related to Java services, where the request init time was being logged with nanosecond precision in the endpoint request. However, the timestamp in the log line already had millisecond precision, rendering the extra digits for the request init unnecessary.
Removing redundant information saves approximately 1GB of storage per day.
Summary
These improvements, facilitated by Vector’s powerful data-shaping capabilities, not only optimised our storage usage but also streamlined our logging processes. We now ensure that only essential information is being logged, eliminating redundancies and aligning our practices with operational requirements and best practices.
The specific changes we implemented and their respective daily log size reductions are as follows:
- Remove excess white space: 3.5GB
- Change requestId format: 28GB
- Change log_file attribute to app attribute: 71GB
- Remove timestamp from log line: 40GB
- Change hostname to IP: 60GB
- Change request init time in Java services: 1GB
- Deduplicate JWT tokens: 25GB to 190GB
With such substantial storage savings, we were well-positioned to resize our AWS OpenSearch cluster and convert these space savings into monetary gains. After careful consideration, we implemented a more cost-effective cluster configuration, reducing the number of nodes and switching to a different node type better suited to our optimised workload.

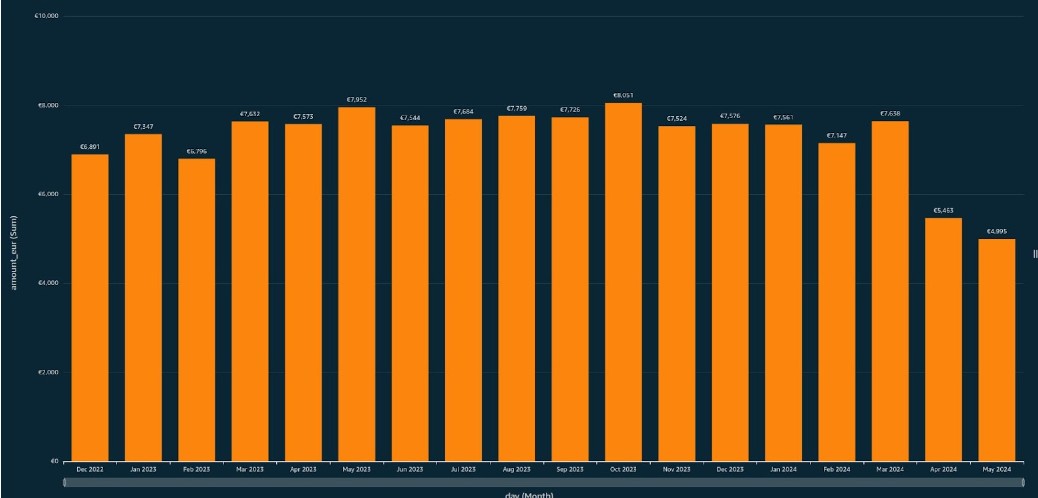
The changes were implemented in April 2024, and the savings are clear in the graph showing the monthly cost of our logging platform. Comparing March to May, we achieved an impressive 35% reduction in costs, translating to over €30K in annual savings.

Just as the Spartans fought valiantly against the Persian empire, these small but strategic changes allowed us to triumph over the seemingly impossible challenge of managing and storing massive volumes of log data. This experience serves as a testament to the fact that even apparently insignificant optimisations can have a profound impact when applied at scale, ultimately leading to substantial gains in efficiency, cost-effectiveness and operational excellence.
